


Economic Shifts Continue
A 12-Month Data Dive (and a Peek at AI's Portfolio Picks)

We are taking another look at the economic landscape, focusing on the changes over the past year and setting the stage for an AI-powered portfolio analysis in our next post. We'll highlight the key shifts since our last post

Consumption:
Private Consumption increased from 2.99% to 3.96%, indicating stronger consumer spending.
Real Private Consumption also increased, from 2.06% to 2.31%, suggesting a rise in inflation-adjusted consumer spending


Fiscal Policy:
Government Consumption increased from 1.92% to 2.50%, showing a rise in government spending.
Real Government Consumption decreased from 1.35% to 0.92%, indicating a slight decline in inflation-adjusted government spending


Housing:
House Price Value for Existing Homes decreased from 0.49% to 0.37%, suggesting a slight cooling in existing home price appreciation.
House Price Value for New Homes decreased from -5.47% to -5.69%, indicating a slightly steeper decline in new home prices.
Residential Building Permits increased slightly from 1.11% to 1.13%


Investment:
Change in Inventories significantly increased from -318.63% to 63.68%, indicating a dramatic shift in inventory levels.
Real Change in Inventories also saw a large increase, from -388.17% to 64.09%.
Investment increased substantially from 1.88% to 6.39%.
Real Investment increased from 1.03% to 5.39%.
Nominal Fixed Investment (gross fixed capital formation) increased from 2.71% to 4.46%.
Real Fixed Investment (gross fixed capital formation) increased from 1.98% to 3.54%


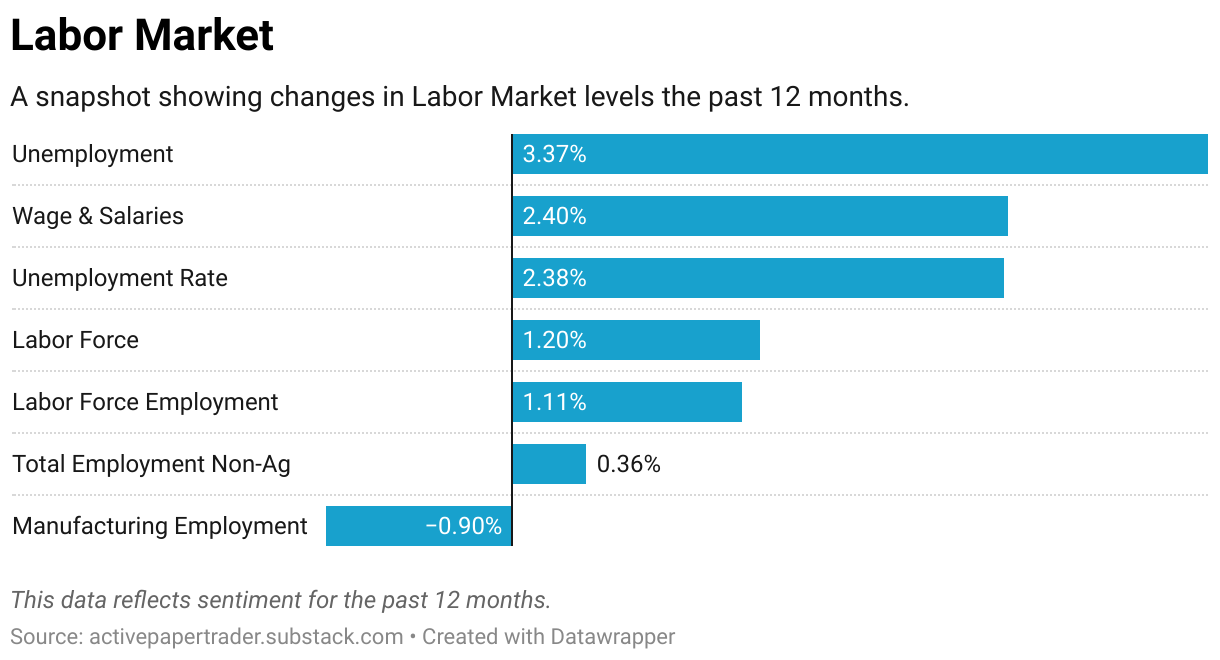
Labor Market:
Unemployment increased from 2.53% to 3.37%, indicating a rise in the number of unemployed individuals.
Wage & Salaries increased from 1.49% to 2.40%, showing stronger wage growth.
Unemployment Rate decreased slightly from 2.58% to 2.38%.
Labor Force increased from 1.00% to 1.20%.
Labor Force Employment increased from 0.94% to 1.11%.
Manufacturing Employment improved slightly, moving from -0.98% to -0.90%

Monetary & Financial:
Stock Market Index improved, moving from -3.08% to -1.56%, indicating a less negative performance.
Average Long-term Government Bond decreased significantly from 1.10% to -2.26%.
Lending Rate improved slightly, moving from -12.16% to -11.79%.
Money Market Rate improved slightly, moving from -13.46% to -12.01%


Trade & International Flows:
Net Exports increased significantly from 2.60% to 26.93%.
Real Net Exports saw a large increase, from 2.92% to 23.81%.
Imports of Goods and Services increased significantly, moving from 2.24% to 10.03%.
Real Imports of Goods and Services increased significantly, moving from 2.23% to 9.59%.
Exports of Goods and Services increased from 2.13% to 3.52%.
Real Exports of Goods and Services increased from 1.95% to 2.21%


No Change:
The following economic indicators showed no change in their average percentage change from the previous data:
Business Confidence
Purchasing Managers Index
Consumer Confidence
Retail Sales
Outstanding Public Debt
Real Government Consumption
House Price Index
Dwelling Stocks
Residential Housing Starts
Building Completions
Producer Price Index (PPI)
Wholesale Price Index
Primary Industries Employment
Agriculture Employment
Capacity Utilization
Balance of Goods
Imports of Goods
Exports of Goods
Gross External Debt
Monetary Policy Rate
Net Migration
Personal Income
Population
Consumer Price Index (CPI)
Nominal Gross Domestic Product
Real Gross Domestic Product
Industrial Production
Treasury Bills (over 31 days)
Key Takeaways:
This latest data paints a complex picture. We see a stronger consumer (increased spending), a significant shift in inventory levels, and increased investment. However, unemployment has also risen, and there are mixed signals in the housing market. Trade shows a significant increase in both imports and exports, with a substantial rise in net exports. Notably, long-term government bond yields have decreased significantly.
Looking Ahead: AI Portfolio Picks
In our next post, we'll leverage AI to analyze these economic trends and identify which of our paper portfolios are best positioned for success in this evolving environment.
